Developers working with msp430 chips often choose between several debugger and programmer options, such as the MSP-FET, LaunchPad onboard debugger, or third-party tools. Selecting the right debugger and programmer impacts the efficiency of msp430 debugging and programming tasks, especially for devices like the msp430fr2111 chip. Key factors include compatibility, ease of use, cost, and software support. Proper debugging ensures reliable performance for all msp430 projects.
Key Takeaways
-
Spy-Bi-Wire uses only two signal lines, making it ideal for small MSP430 devices with limited pins and simpler board designs.
-
USB connectivity is common for MSP430 debuggers, allowing easy and fast programming and debugging with many official and third-party tools.
-
The MSP-FET debugger offers advanced features and broad device support, best for professionals and large projects, but costs more.
-
LaunchPad debuggers are affordable, easy to use, and great for students and hobbyists starting with MSP430 development.
-
Open-source and third-party tools provide flexible and budget-friendly options but may need extra setup and have varying support.
Spy-Bi-Wire and USB Overview
What Is Spy-Bi-Wire?
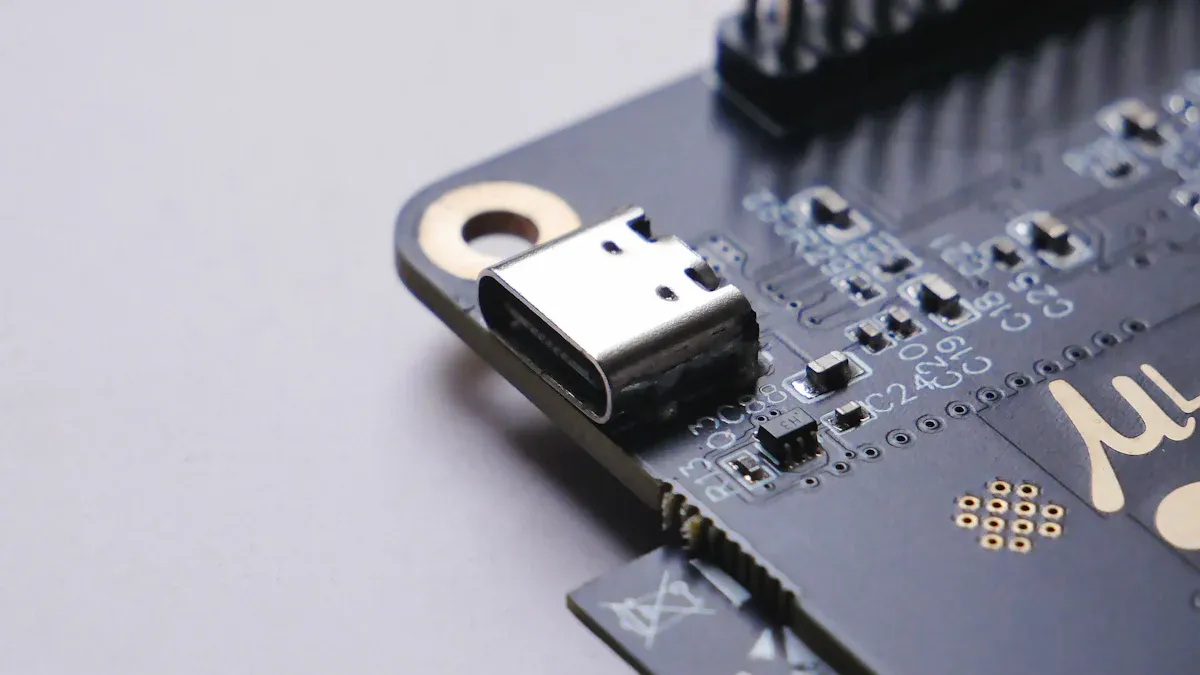
Spy-Bi-Wire is a streamlined debugging interface developed for msp430 microcontrollers. It uses only two signal lines, along with power and ground, to communicate with the target device. This approach reduces the number of pins needed for programming and debugging, making it ideal for compact designs. Many engineers prefer Spy-Bi-Wire because it simplifies board layout and lowers the risk of signal interference. The interface supports both programming and real-time debugging, which helps developers quickly identify and fix issues in their msp430 projects.
Tip: Spy-Bi-Wire works especially well with msp430 devices that have limited pin counts. It allows for efficient use of available hardware resources.
USB for MSP430 Debugging
USB connectivity has become the standard for connecting msp430 development tools to computers. Most modern usb debuggers use usb ports to provide fast and reliable communication between the host PC and the target microcontroller. This setup enables developers to program and debug their devices without needing specialized hardware ports.
The table below shows how different tools support usb connectivity and various protocols for msp430 debugging:
|
Tool Name |
Manufacturer |
USB Connectivity |
Supported Protocols |
Status |
|---|---|---|---|---|
|
MSP-FET430UIF |
TI |
Yes |
JTAG, Spy-Bi-Wire |
Active |
|
MSP-FET |
TI |
Yes |
JTAG, Spy-Bi-Wire |
Active |
|
MSP-430 LaunchPad |
TI |
Yes |
Spy-Bi-Wire |
Active |
|
MSP-430 LaunchPad eZ-FET |
TI |
Yes |
Spy-Bi-Wire |
Active |
|
eZ430-F2013 |
TI |
Yes |
Spy-Bi-Wire |
Obsolete |
|
eZ430-RF2500 |
TI |
Yes |
Spy-Bi-Wire |
Active |
|
USBP |
SoftBaugh |
Yes |
JTAG, Spy-Bi-Wire |
Discontinued |
|
MSP430-JTAG-ISO |
Olimex |
Yes |
JTAG, Spy-Bi-Wire |
Obsolete |
|
MSP430-JTAG-ISO-MK2 |
Olimex |
Yes |
JTAG, Spy-Bi-Wire |
Active |
|
MSP430-JTAG-Tiny |
Olimex |
Yes |
JTAG, Spy-Bi-Wire |
Not Found |
|
MSP430-JTAG-TINY-V2 |
Olimex |
Yes |
JTAG?, Spy-Bi-Wire |
Unknown |
|
MSP430-JTAG-RF |
Olimex |
Yes |
JTAG, Spy-Bi-Wire |
Active |
|
FlashPro-CC |
Elprotronic |
Yes |
JTAG, Spy-Bi-Wire, BSL |
Active |
|
VisSim/ECD |
Visual Solutions |
Yes |
JTAG, Spy-Bi-Wire |
Active |
|
LA-3713 |
Lauterbach |
USB/Ethernet |
JTAG, Spy-Bi-Wire |
Active |
Most tools in the table support both JTAG and Spy-Bi-Wire protocols through usb. This flexibility allows developers to choose the best option for their msp430 device. USB connectivity also ensures compatibility with popular development environments and operating systems. When selecting a debugging interface, engineers should check protocol support and tool status to ensure smooth development.
Official MSP430 Debugger and Programmer Options
MSP-FET
The MSP-FET stands as the official debugger and programmer for msp430 chips. Texas Instruments designed this tool for both professional engineers and students. The MSP-FET connects to a computer through usb and supports both Spy-Bi-Wire and JTAG protocols. This flexibility allows users to work with a wide range of msp430 devices.
Key Features of MSP-FET:
-
Supports Spy-Bi-Wire and JTAG interfaces
-
Connects to PC using usb
-
Provides fast programming and debugging speeds
-
Offers robust protection against overcurrent and voltage spikes
-
Compatible with most msp430 microcontrollers
Pros:
-
Reliable and stable connection for debugging
-
Works with many development environments, including Code Composer Studio and IAR Embedded Workbench
-
Supports advanced features like energy measurement
Cons:
-
Higher price compared to other options
-
Larger physical size may not suit portable setups
Note: The MSP-FET gives developers a professional-grade experience. It works well for large projects and long-term use.
LaunchPad Debugger
The launchpad debugger offers a popular and affordable solution for msp430 development. Texas Instruments includes this debugger on many launchpad boards. Each launchpad board provides a built-in debugger that connects to the target msp430 microcontroller through Spy-Bi-Wire. Some launchpad models also support JTAG, but Spy-Bi-Wire remains the most common protocol.
LaunchPad Debugger Highlights:
-
Integrated on launchpad development boards
-
Uses usb for easy connection to a computer
-
Supports Spy-Bi-Wire (and sometimes JTAG)
-
Allows users to program and debug msp430 devices directly
Advantages:
-
Low cost, making it ideal for students and hobbyists
-
Compact and portable design
-
Easy to set up with minimal extra hardware
Limitations:
-
May not support all advanced features found in the MSP-FET
-
Debugging speed and reliability can vary between launchpad models
-
Some launchpad boards only support specific msp430 families
|
Feature |
MSP-FET |
LaunchPad Debugger |
|---|---|---|
|
Protocols Supported |
Spy-Bi-Wire, JTAG |
Spy-Bi-Wire, JTAG* |
|
USB Connectivity |
Yes |
Yes |
|
Price |
Higher |
Low |
|
Portability |
Moderate |
High |
|
Advanced Features |
Yes |
Limited |
|
Target Device Support |
Broad |
Varies by launchpad |
*Some launchpad boards support JTAG, but most use Spy-Bi-Wire.
Tip: The launchpad debugger works best for learning and small projects. Users can upgrade to the MSP-FET for more advanced needs.
Both the MSP-FET and launchpad debugger provide strong options for msp430 programming and debugging. The MSP-FET suits professionals who need advanced features and broad compatibility. The launchpad debugger fits students, hobbyists, and anyone starting with msp430 chips. Each debugger and programmer supports usb connectivity, making setup simple and reliable.
Third-Party and Open-Source Debugger and Programmer Options
GoodFET and Open-Source Tools
Many developers explore open-source solutions when working with msp430 hardware design. GoodFET stands out as a popular open-source debugger for msp430 chips. This tool uses a USB interface and supports Spy-Bi-Wire, making it suitable for both programming and debugging tasks. GoodFET offers flexibility for those who want to modify or extend its features. The open-source community often updates its firmware and software, which helps users keep up with new msp430 devices.
Other open-source tools, such as GDB, provide advanced debugging features. GDB supports multiple programming languages and allows remote debugging, variable monitoring, and function invocation. These features help developers find and fix problems quickly. Many open-source tools offer strong integration with popular development environments. For example, SonarLint works as an IDE extension and provides real-time bug detection. These tools often have robust communities and active forums, which makes troubleshooting easier.
Note: Open-source debuggers may require extra configuration to work with a custom msp430 board. Users should check compatibility before starting a project.
Olimex and Tag-Connect
Olimex produces several third-party debugger and programmer options for msp430. Their devices, such as the MSP430-JTAG-ISO-MK2 and MSP430-JTAG-RF, support both JTAG and Spy-Bi-Wire protocols. These tools connect to a computer using USB and work with many msp430 microcontrollers. Olimex debuggers often cost less than official options, making them attractive for budget-conscious users.
Tag-Connect offers a unique approach with its no-solder cables. These cables connect directly to the programming pads on a custom msp430 board. Tag-Connect solutions save space and reduce wear on the board. Many engineers use Tag-Connect with Olimex or other third-party debuggers to streamline their workflow.
The following table compares key metrics between official and third-party/open-source tools:
|
Metric |
Built-in (Official) Tools |
Third-party / Open-source Tools |
|---|---|---|
|
Compatibility |
Inherently compatible and well-integrated with environment |
May require additional configuration for seamless integration |
|
Feature Integration |
Basic debugging features (error identification, breakpoints) |
Advanced features (performance profiling, real-time error tracking) |
|
User Interface |
Often basic, steeper learning curve |
More intuitive, user-friendly, better data visualization |
|
Community & Support |
Official documentation, smaller community |
Robust community, extensive documentation, active forums |
|
Customizability |
Limited |
Higher customizability and extensibility |
Olimex and Tag-Connect products often appeal to users who want more control over their debugging setup. These tools provide advanced features, such as performance profiling and real-time error tracking, which can help improve project outcomes.
Custom Solutions
Some developers design custom solutions for msp430 debugging. They build their own Spy-Bi-Wire to USB adapters or modify existing hardware to fit specific needs. Custom solutions can offer high flexibility and low cost, especially for unique msp430 hardware design projects. However, these setups may require deep technical knowledge and extra time for troubleshooting.
The community shows strong interest in custom adapters, especially for projects that use a custom msp430 board. Many online forums and open-source repositories share schematics and firmware for DIY debuggers. While these solutions can work well, they may lack the reliability and support found in official or commercial products.
⚠️ Custom debugger and programmer setups may not support all msp430 features. Users should test thoroughly before relying on them for critical projects.
Third-party and open-source options give developers more choices for msp430 programming and debugging. These tools often provide advanced features, better user interfaces, and strong community support. However, users must consider compatibility and support when choosing a debugger for their msp430 chips.
Comparison Table
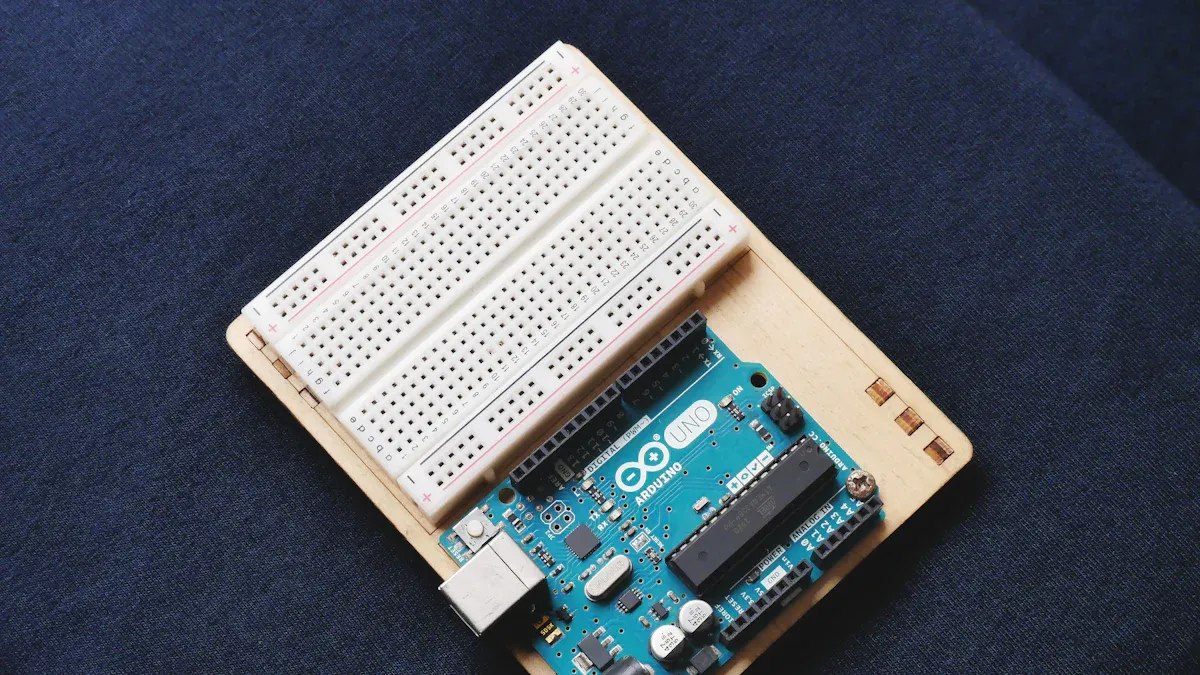
Choosing the right debugger or programmer for msp430 chips often depends on several factors. The following table compares popular options based on compatibility, price, software support, and ease of use. This structured approach helps readers quickly analyze which tool best fits their needs.
|
Tool/Option |
Compatibility (Protocols/Chips) |
Price (USD) |
Software Support |
Ease of Use |
Availability |
|---|---|---|---|---|---|
|
MSP-FET |
Spy-Bi-Wire, JTAG; Most msp430 |
$120-150 |
Official IDEs, CLI |
Moderate |
Widely available |
|
LaunchPad Debugger |
Spy-Bi-Wire; Select msp430 |
$10-30 |
Official IDEs |
High |
Widely available |
|
GoodFET (Open-Source) |
Spy-Bi-Wire; Many msp430 |
$30-50 |
Community, CLI |
Moderate |
Limited, DIY |
|
Olimex Debuggers |
Spy-Bi-Wire, JTAG; Many msp430 |
$40-80 |
Official IDEs, CLI |
Moderate |
Available online |
|
Tag-Connect (Cable) |
Spy-Bi-Wire; Custom boards |
$20-40 |
Depends on debugger |
High |
Available online |
|
Custom Solutions |
Varies; Custom msp430 boards |
$10+ |
Community, DIY scripts |
Low-Moderate |
DIY only |
Compatibility
The table above displays compatibility by listing supported protocols and chip families. Most official tools, such as MSP-FET and LaunchPad Debugger, support both Spy-Bi-Wire and JTAG, making them suitable for a wide range of msp430 devices. Third-party and open-source options may require extra configuration but often cover many msp430 models. This structured comparison allows users to see at a glance which debugger interfaces match their project requirements.
Price and Availability
Pricing for msp430 debugger solutions varies. The LaunchPad Debugger offers an affordable entry point at around $10-30. GoodFET and Olimex options provide budget-friendly alternatives, with some hardware available for about $30. Free software toolsets, like MSP430-GCC, further reduce costs for beginners. Most official and third-party tools remain widely available, while custom solutions require DIY assembly and sourcing.
💡 Low-cost hardware and free software make msp430 development accessible for students and hobbyists.
Software Support
Official tools, such as MSP-FET, receive regular updates and integrate well with Texas Instruments’ IDEs. Some third-party programmers, like certain USB JTAG options, have not seen firmware updates since their initial release. Developers often prioritize reliability over speed, following TI’s programming specifications. Open-source tools rely on community support, which can vary in quality and update frequency.
Ease of Use
LaunchPad Debuggers and Tag-Connect cables offer the simplest setup for most users. Official tools provide clear documentation and easy integration with development environments. Open-source and custom solutions may require more technical knowledge and troubleshooting. Users should consider their experience level and project needs when selecting a debugger for msp430 chips.
MSP430 Programming: Software Support
Code Composer Studio
Code Composer Studio (CCS) serves as the primary integrated development environment for programming msp430 chips. Texas Instruments provides this tool with a user-friendly interface and strong debugging features. Many developers choose CCS because it supports both beginners and professionals. The Grace graphical configuration tool, when used with CCS, can greatly speed up msp430 programming. For example, some users have reported reducing the time needed to write a PWM routine from a month to just 30 minutes by using Grace. CCS offers a free version, which is often enough for hobbyists working on small projects. While CCS provides professional-grade features, some users find it complex at first. The tool does not support Linux, which may limit its use for some developers. Compared to the Arduino IDE, CCS offers more advanced features but may require a steeper learning curve.
💡 CCS combines powerful debugging tools with a flexible workspace, making it a strong choice for programming msp430 chips.
IAR Embedded Workbench
IAR Embedded Workbench stands out as a comprehensive development environment for msp430. It includes an optimized compiler, advanced debugger, and analysis tools. Official documentation highlights features such as real-time trace, code coverage, and RTOS awareness. A benchmark test compared IAR Embedded Workbench to Rowley’s CrossWorks by running a BASIC interpreter loop with one million iterations. IAR completed the task in 71 seconds, while Rowley’s tool finished in 58 seconds. This result shows that IAR delivers solid performance, though not always the fastest. Developers value IAR for its broad device support and efficient code generation. The tool helps create reliable and high-quality embedded applications.
MSPDebug and CLI Tools
MSPDebug and other command-line interface (CLI) tools provide lightweight options for programming msp430 chips. These tools work well for users who prefer scripting or automation. MSPDebug supports many third-party and open-source debuggers, making it flexible for different hardware setups. Developers can use CLI tools to upload code, set breakpoints, and monitor device status. These tools often require more technical knowledge but offer great control over the programming process. MSPDebug helps users manage both programming and debugging tasks efficiently.
Choosing the Right Debugger and Programmer
For Hobbyists and Students
Hobbyists and students often look for tools that are easy to use and affordable. The LaunchPad debugger offers a simple setup and works well for learning. Many users choose this option because it comes with clear instructions and strong community support. The LaunchPad debugger also fits small projects and classroom environments. Students can start programming quickly without extra hardware.
💡 Tip: Beginners should check if their development board supports the target microcontroller before starting a project.
For Professionals
Professional engineers need reliable and feature-rich tools. The MSP-FET provides advanced debugging features and supports a wide range of devices. Many professionals select this tool for its speed and stability. Third-party debuggers from companies like Olimex also appeal to professionals who want flexibility or need to work with custom hardware. These tools often include extra features, such as energy measurement and performance profiling.
Budget Considerations
Cost plays a big role in selecting a debugger or programmer. The LaunchPad debugger offers a low-cost entry point. Open-source options, like GoodFET, provide affordable alternatives for those willing to build or configure their own hardware. Professionals may invest in higher-priced tools, such as the MSP-FET, to gain advanced features and long-term reliability.
|
User Type |
Recommended Option |
Price Range |
|---|---|---|
|
Hobbyist/Student |
LaunchPad Debugger |
$10–$30 |
|
Professional |
MSP-FET, Olimex |
$40–$150 |
|
DIY/Advanced |
GoodFET, Custom |
$10–$50 |
Key Factors
When choosing a debugger or programmer, users should consider several factors:
-
Compatibility: Check if the tool supports the target device and protocol.
-
Software Support: Make sure the tool works with preferred development environments.
-
Ease of Use: Look for clear documentation and simple setup.
-
Availability: Confirm the tool is easy to purchase or build.
-
Project Needs: Match the tool’s features to the project’s complexity.
Selecting the right tool helps users save time and avoid frustration during development.
Selecting the right debugger or programmer for MSP430FR microcontrollers shapes project success. Developers should match their choice to project needs, considering compatibility, software support, and budget. The table below shows how these factors influence debugging outcomes:
|
Factor Category |
Description |
|---|---|
|
Compatibility |
Control over code, libraries, and project ownership |
|
Software Support |
Usability and availability of debugging tools and support systems |
|
Tool Availability |
Access to debuggers, logs, and simulation tools |
|
Project Requirements |
Deadlines, documentation, and project rules |
Official resources, like the MSP430 LaunchPad website, guide users through setup, troubleshooting, and validation. Community forums such as 43oh.com offer extra support and real-world advice. Developers benefit by reviewing both official documentation and active forums before starting new projects.
What is the main difference between Spy-Bi-Wire and JTAG?
Spy-Bi-Wire uses only two signal lines for communication, while JTAG uses four or more. Spy-Bi-Wire works well for small devices with limited pins. JTAG offers more features but needs more board space.
Can users program MSP430FR chips on Linux?
Yes, users can program MSP430FR chips on Linux. Tools like MSPDebug and msp430-gcc support Linux. Code Composer Studio does not support Linux, so users must choose compatible software.
Do all LaunchPad boards support every MSP430FR device?
No, not every LaunchPad board supports all MSP430FR devices. Each board works with specific microcontrollers. Users should check the board’s documentation before starting a project.
Is it possible to use open-source debuggers with official Texas Instruments software?
Open-source debuggers like GoodFET may not work with all Texas Instruments software. Most official tools, such as Code Composer Studio, support only TI-approved hardware. Users should check compatibility before choosing a debugger.
See Also
Three Best Methods To Integrate MC9S12XET512VAG
Choosing Between CYUSB3014-BZXI And BZXC Controllers
Enhancing Process Control By Unlocking AD74413RBCPZ
Improving Automotive Performance Using NXP MC9S12X Series
Simplified Engine Control With SPC56 Microcontrollers
